Graphing Exponential Functions
Example
Graph

Solution
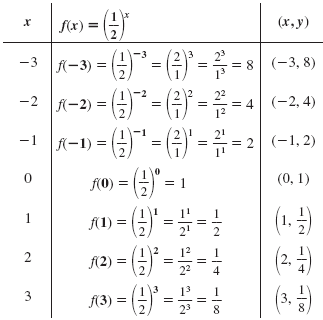
Step 1 Make a table of ordered pairs.
We will let x be integers from -3 through 3.

Note:
Recall this useful property of
negative exponents:

Thus,

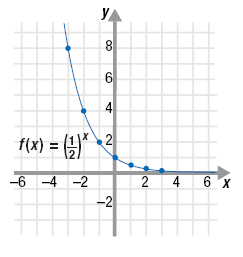
Step 2 Plot the ordered pairs.
See the graph.

Step 3 Sketch a smooth curve through the plotted points.
The smooth curve represents all the ordered pairs that satisfy

The x-axis acts as a horizontal asymptote for
 This is because
as the values of x approach positive infinity, +∞, the values of This is because
as the values of x approach positive infinity, +∞, the values of
 approach 0, but never reach 0. approach 0, but never reach 0.
|