Graphing Functions
Functions can be expressed in a variety of ways, including using words,
algebraic equations, tables, and graphs.
Tables and graphs are often used to make it easier to visualize how the
input and the output are related.
Procedure — To Graph a Function
Step 1 Make a table of ordered pairs that satisfy the function.
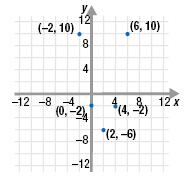
Step 2 Plot the ordered pairs on a Cartesian coordinate system.
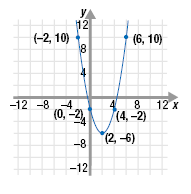
Step 3 Connect the plotted points with a smooth line.
Example
Graph the function: f(x) = x2 - 4x - 2
Solution
Step 1 Make a table of ordered pairs.
We can select any values we want for x and then calculate the
corresponding values for f(x). We will let x = -2, 0, 2, 4, and 6.
|
x |
f(x)
= x2 - 4x
- 2 |
(x, y) |
|
-2
0
2
4 6 |
f(-2)
= (-2)2
- 4(-2) - 2
= 4 + 8 - 2
= 10
f(0) = (0)2 -
4(0) - 2 = 0
- 0 - 2 = -2
f(2) = (2)2 -
4(2) - 2 = 4
- 8 - 2 = -6
f(4) = (4)2 -
4(4) - 2 = 16
- 16 - 2 = -2
f(6) = (6)2 - 4(6)
- 2 = 36 -
24 - 2 = 10 |
(-2, 10) (0, -2)
(2, -6)
(4, -2) (6, 10) |
Step 2 Plot the ordered pairs.

Step 3 Connect the plotted points.

Note:
When we say “connect the plotted pointsâ€
we mean to draw a smooth line between
them, and also to continue the line past the
end points.
That is, the graph should not stop at the
plotted end points; it should continue
past those points following the pattern of
the graph.
|