Rise and Run
Definition of Rise and Run
Suppose a car is traveling at a constant speed of 40 miles per hour. If we
let d represent the miles traveled and t represent the hours traveled, then
the relationship between d and t is given by:
d = 40t
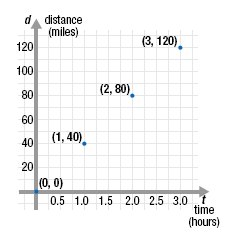
Here is a data table and a graph of the data.
|
t time (hours) |
d
distance (miles) |
ordered pairs |
 |
|
0 |
0 |
(0, 0) |
|
1 |
40 |
(1, 40) |
|
2 |
80 |
(2, 80) |
|
3 |
120 |
(3, 120) |
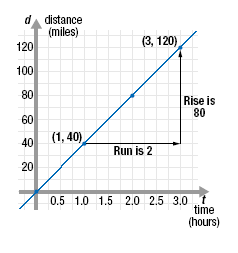
In the second graph, we connect the points with a line to show all the
solutions of d = 40t.

The coordinates of each point on the line satisfies the equation.
Now we will look at the vertical and horizontal changes that occur as we
move from one point to another on the graph.
The rise is the vertical change in moving from one point to another on
the graph. For this graph, the rise represents the change in the distance
traveled.
For example, the rise from (1, 40) to (3, 120) is 80. This represents a
change in distance of 80 miles.
The run is the horizontal change in moving from one point to another
on the graph. For this graph, the run represents the change in the time
traveled.
For example, the run from (1, 40) to (3, 120) is 2. This represents a change
in time of 2 hours.
Finding the Rise and Run
The rise and the run between two given points may be found in two ways:
Use the graph:
• To find the rise, count the vertical units moved in going from the
first point to the second point.
• To find the run, count the horizontal units moved in going from the
first point to the second point.
Use algebra:
• To find the rise, subtract the y-coordinate of the first point from the
y-coordinate of the second point.
• To find the run, subtract the x-coordinate of the first point from the
x-coordinate of the second point.
|